3QFY2016 Result Update | Writing Instruments
February 08, 2016
Linc Pen & Plastics
NEUTRAL
CMP
`201
Performance Highlights
Target Price
-
Quarterly Data
Investment Period
12 months
(` cr)
3QFY16
3QFY15
% yoy
2QFY16
% qoq
Revenue
72
69
4.6
88
(17.7)
Stock Info
EBITDA
6.4
6
10.3
8
(19.4)
Sector
Writing Instruments
Margin (%)
8.9
8.4
46bp
9.1
(19bp)
Market Cap (` cr)
288
Adj. PAT
3
3
4.2
5
(34.7)
Net Debt (` cr)
16
Source: Company, Angel Research
Beta
1.1
Linc Pen & Plastics Ltd (LPPL)’s 3QFY2016 results have come in below our
52 Week High / Low
243 / 146
estimates.
The
company’s
top-line
for
the
quarter
grew
Avg. Daily Volume
10,582
5% yoy. On the operating front, the company reported margin improvement,
Face Value (`)
10
primarily on account of lower raw material costs. Further, on the bottom-line
BSE Sensex
24,617
front, the company reported a soft ~4% yoy growth on account of lower sales
Nifty
7,489
growth.
Reuters Code
LINC.BO
Bloomberg Code
LPP@IN
Top-line grew ~5% yoy: The company’s top-line grew by ~5% yoy to ~`72cr
(which is below our estimate of ~`75cr), mainly due to a poor sales performance
on the export front (8.3% yoy de-growth due to geographical instability and
Shareholding Pattern (%)
currency volatility). However, domestic sales grew by ~11.5% yoy.
Promoters
60.4
MF / Banks / Indian Fls
0.0
PAT grew ~4% yoy: Despite margin expansion, the reported net profit grew by a
FII / NRIs / OCBs
0.2
soft ~4% yoy to ~`3.3cr (which is below our estimates of ~`3.6cr) on account of
Indian Public / Others
39.4
lower sales growth and higher tax rate.
Outlook and valuation: Going ahead, we expect LPPL to report a top-line CAGR
Abs. (%)
3m 1yr 3yr
of ~8% over FY2015-17E to ~`371cr owing to strong domestic as well as export
Sensex
(6.4)
(14.7)
25.2
sales. On the bottom-line front, we expect the company to report ~17% CAGR
LPPL
19.9
3.9
352.9
over FY2015-17E. This would be on account of expansion in operating margin on
the back of lower material prices and higher exports, which is a high margin
business. Further, the company has reduced its debt significantly, which will lead
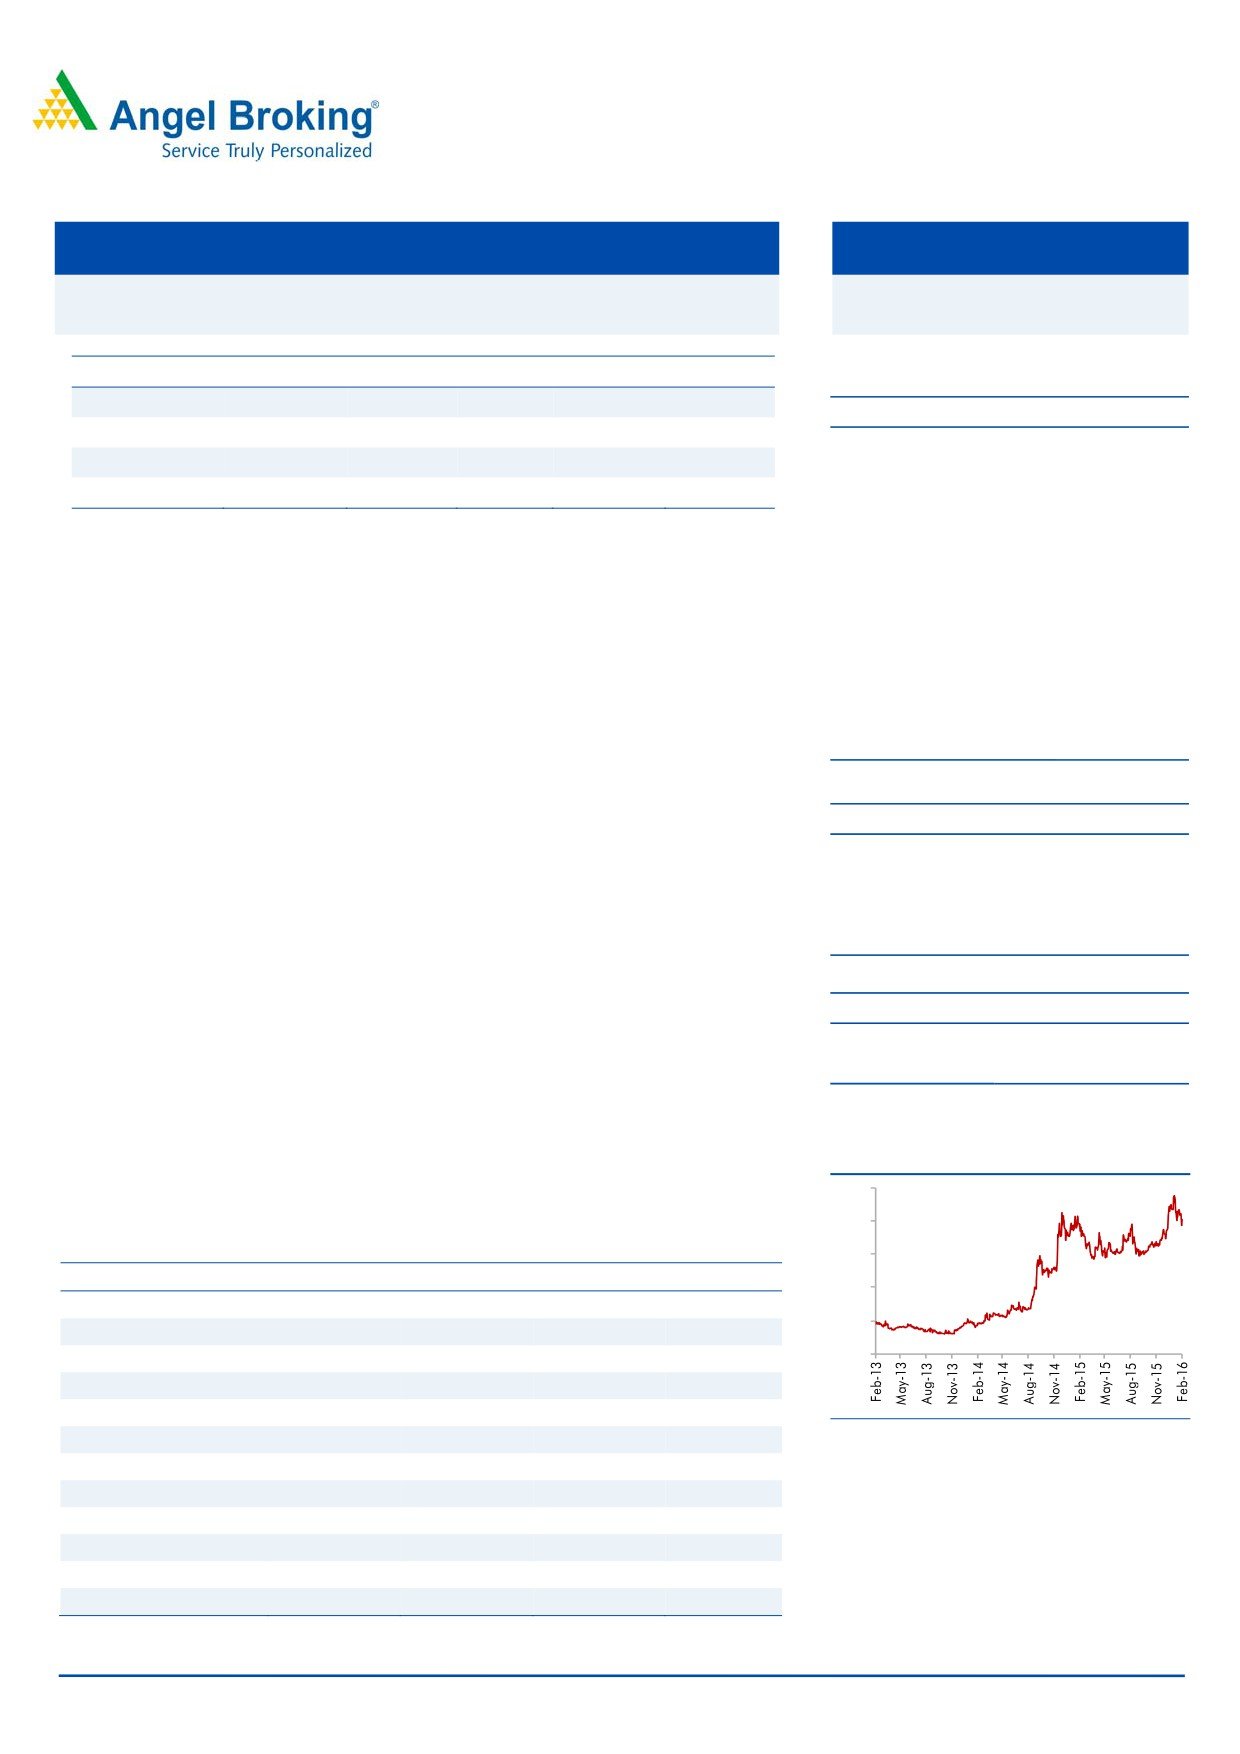
3-year price chart
to cost saving for the company. We have a NEUTRAL rating on the stock since all
250
the positives are factored in the stock price.
200
Key financials
150
Y/E March (` cr)
FY2014
FY2015
FY2016E
FY2017E
100
Net sales
314
318
340
371
50
% chg
2.9
1.3
6.7
9.2
0
Net profit
12
14
16
20
% chg
112.4
24.4
11.8
22.1
EBITDA margin (%)
7.0
7.9
8.3
8.9
EPS (`)
7.8
9.7
10.8
13.2
Source: Company, Angel Research
P/E (x)
25.8
20.8
18.6
15.2
P/BV (x)
3.8
3.4
3.0
2.6
RoE (%)
14.6
16.2
16.0
17.1
RoCE (%)
15.2
18.3
19.0
20.3
EV/Sales (x)
1.1
1.0
0.9
0.8
Amarjeet S Maurya
EV/EBITDA (x)
15.0
12.4
10.9
9.3
022-39357800 Ext: 6831
Source: Company, Angel Research, Note: CMP as of February 05, 2016
Please refer to important disclosures at the end of this report
1
Linc Pen & Plastics | 3QFY2016 Result Update
Exhibit 1: Quarterly performance
Y/E March (` cr)
3QFY16
3QFY15
% yoy
2QFY16
% qoq
9MFY16
9MFY15
% chg
Net Sales
72
69
4.6
88
(17.7)
239
226
5.9
Consumption of RM
45
45
1.0
56
(20.0)
152
150
1.4
(% of Sales)
62.3
64.5
64.1
63.7
66.5
Staff Costs
4
4
1.6
5
(6.2)
13
12
10.2
(% of Sales)
6.0
6.2
5.3
5.6
5.4
Operating Expense
16
14
14.2
19
(12.8)
53
45
16.9
(% of Sales)
22.8
20.9
21.5
22.0
19.9
Total Expenditure
66
63
4.1
80
(17.5)
218
207
5.3
Operating Profit
6
6
10.3
8
(19.4)
21
18
13.0
OPM (%)
8.9
8.4
9.1
8.7
8.2
Interest
0
0
60.2
0
211.0
1
1
(19.6)
Depreciation
1
2
(3.8)
1
6.2
4
4
0.2
Other Income
0
0
(84.8)
0
(79.6)
0
0
(40.0)
PBT
4
4
10.7
6
(30.6)
16
13
19.3
(% of Sales)
6.2
5.9
7.4
6.6
5.8
Provision for Taxation
1
1
33.0
1
(16.4)
4
3
38.4
(% of PBT)
27.0
22.5
22.4
23.2
20.0
Minority Interest
Reported PAT
3
3
4.2
5
(34.7)
12
11
14.6
PATM
4.5
4.5
5.7
5.0
4.7
Source: Company, Angel Research
February 08, 2016
2
Linc Pen & Plastics | 3QFY2016 Result Update
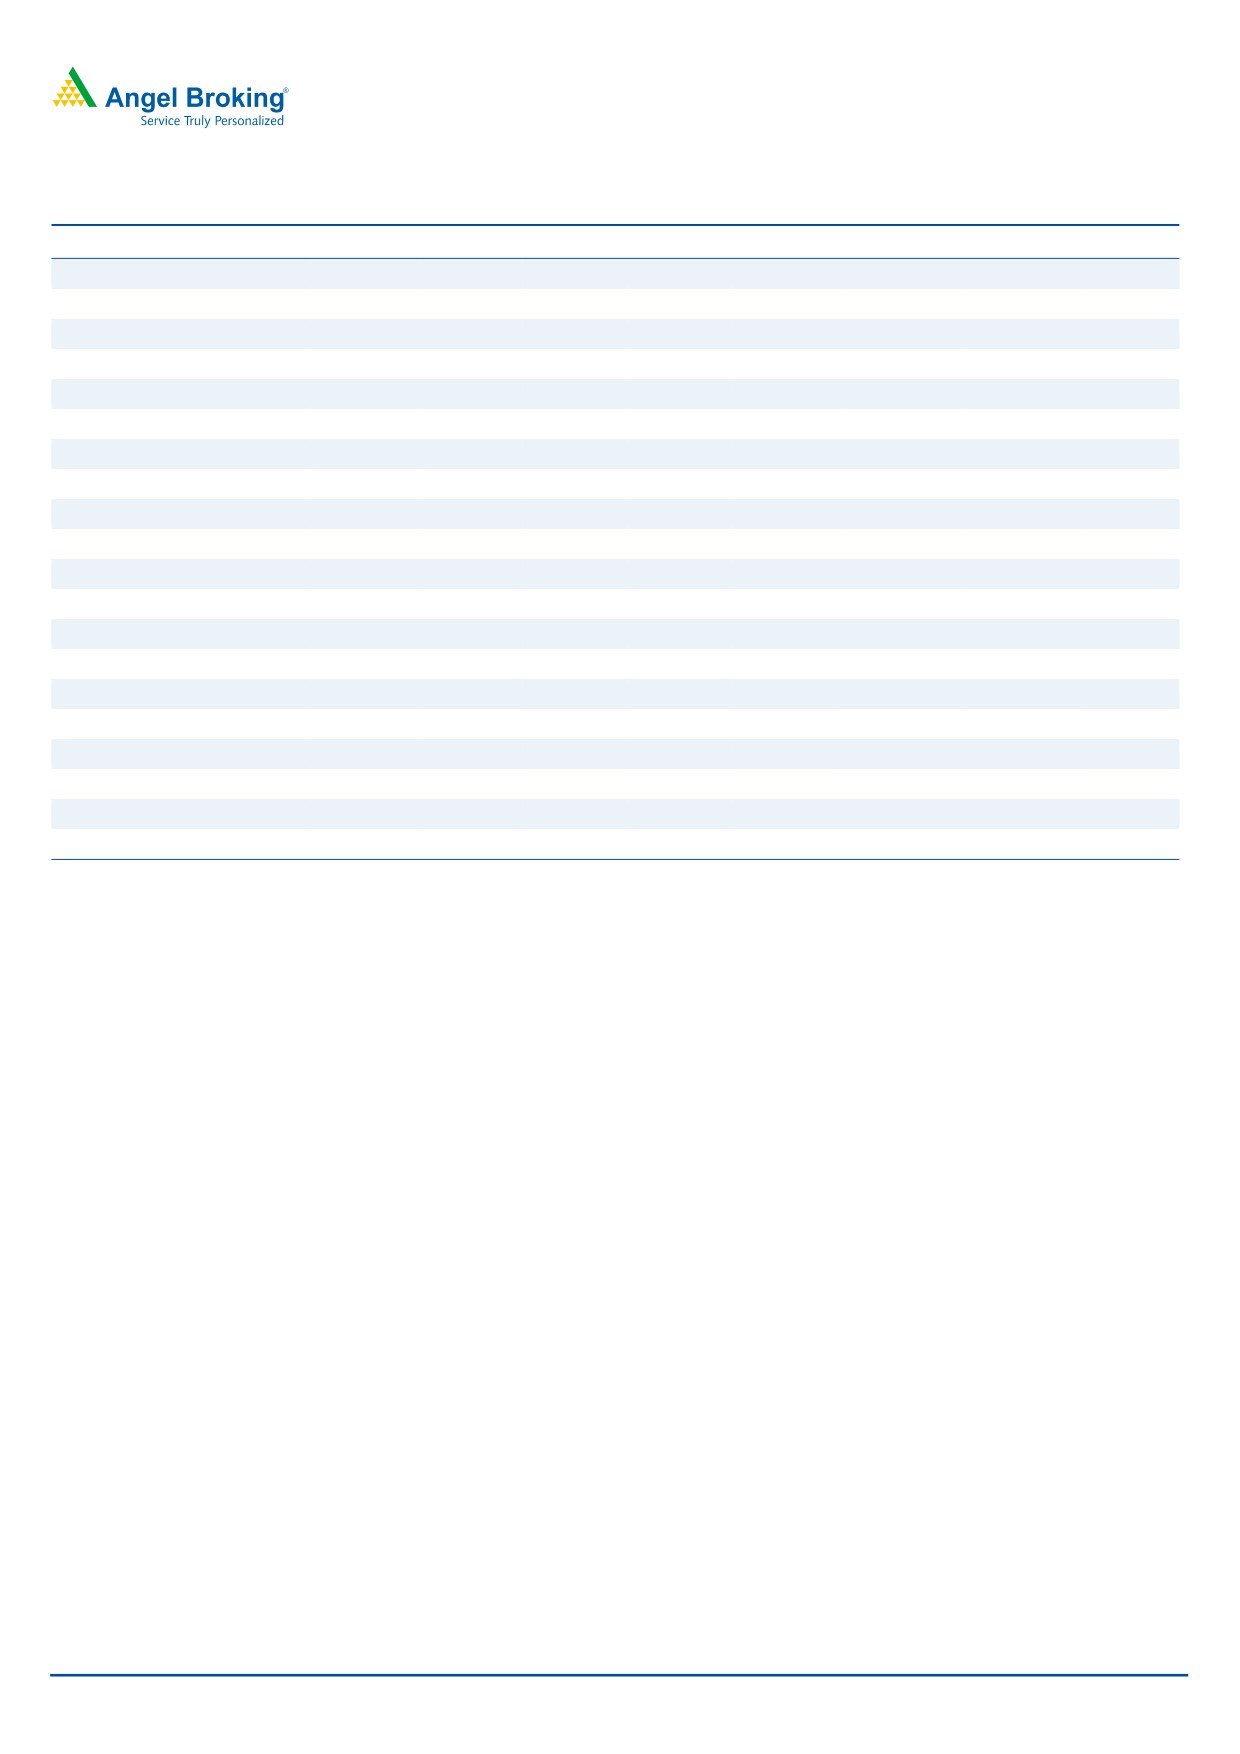
Top-line grows 5% yoy
The company’s top-line grew by ~5% yoy to ~`72cr (which is below our estimate
of ~`75cr), mainly due to a poor sales performance on the export front (8.3% yoy
de-growth due to geographical instability and currency volatility). However,
domestic sales grew by ~11.5% yoy.
Exhibit 2: Top-line growth trend
40
100
90
30
80
70
20
60
10
50
0
40
30
-10
20
-20
10
0
-30
Net sales
QoQ growth (%)
Source: Company, Angel Research
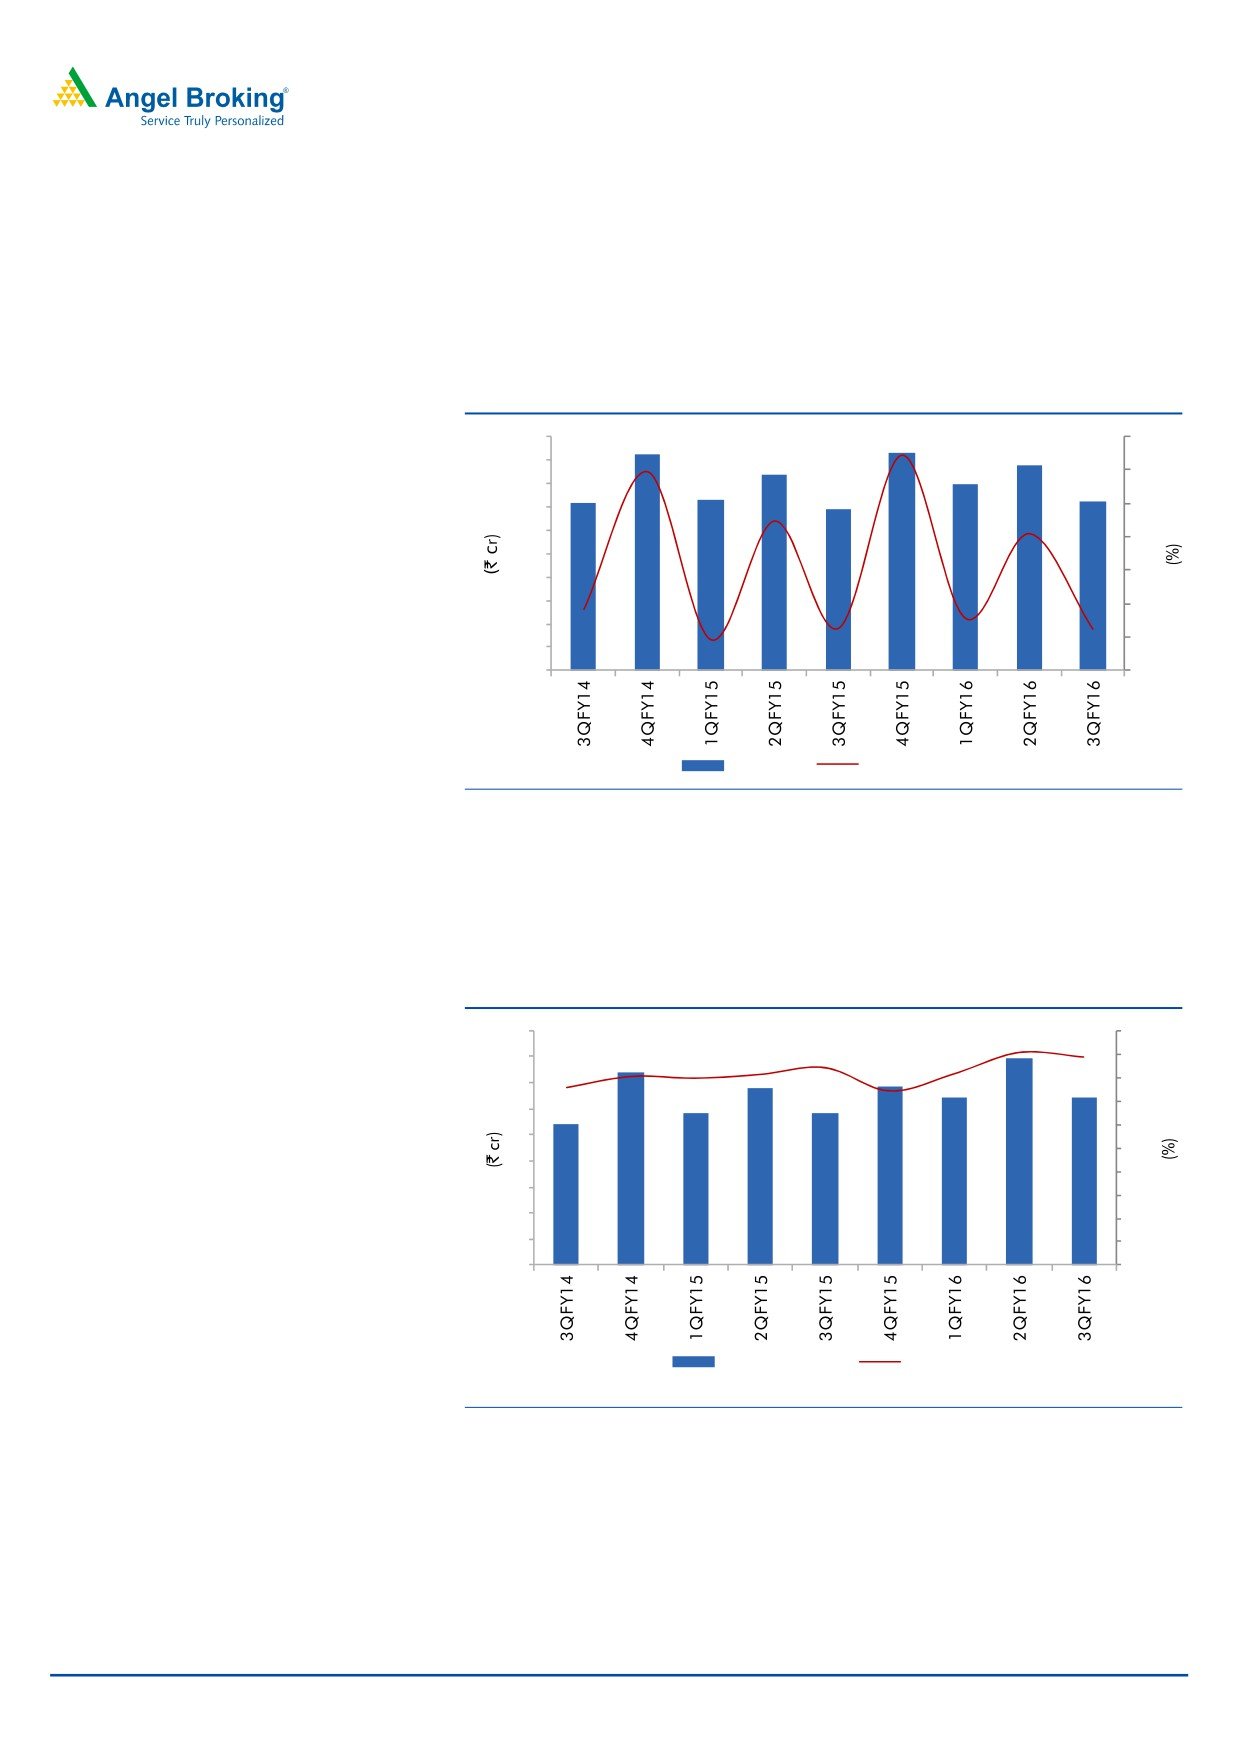
Operating margin expansion due to falling material prices
On the operating front, the company reported margin improvement by 46bp yoy
to 8.9%, primarily on account of lower raw material costs.
Exhibit 3: Operating profit and margin trend
9
10
8
9
8
7
7
6
6
5
5
4
4
3
3
2
2
1
1
0
0
Operating Profit
Margin (%)
Source: Company, Angel Research
February 08, 2016
3
Linc Pen & Plastics | 3QFY2016 Result Update
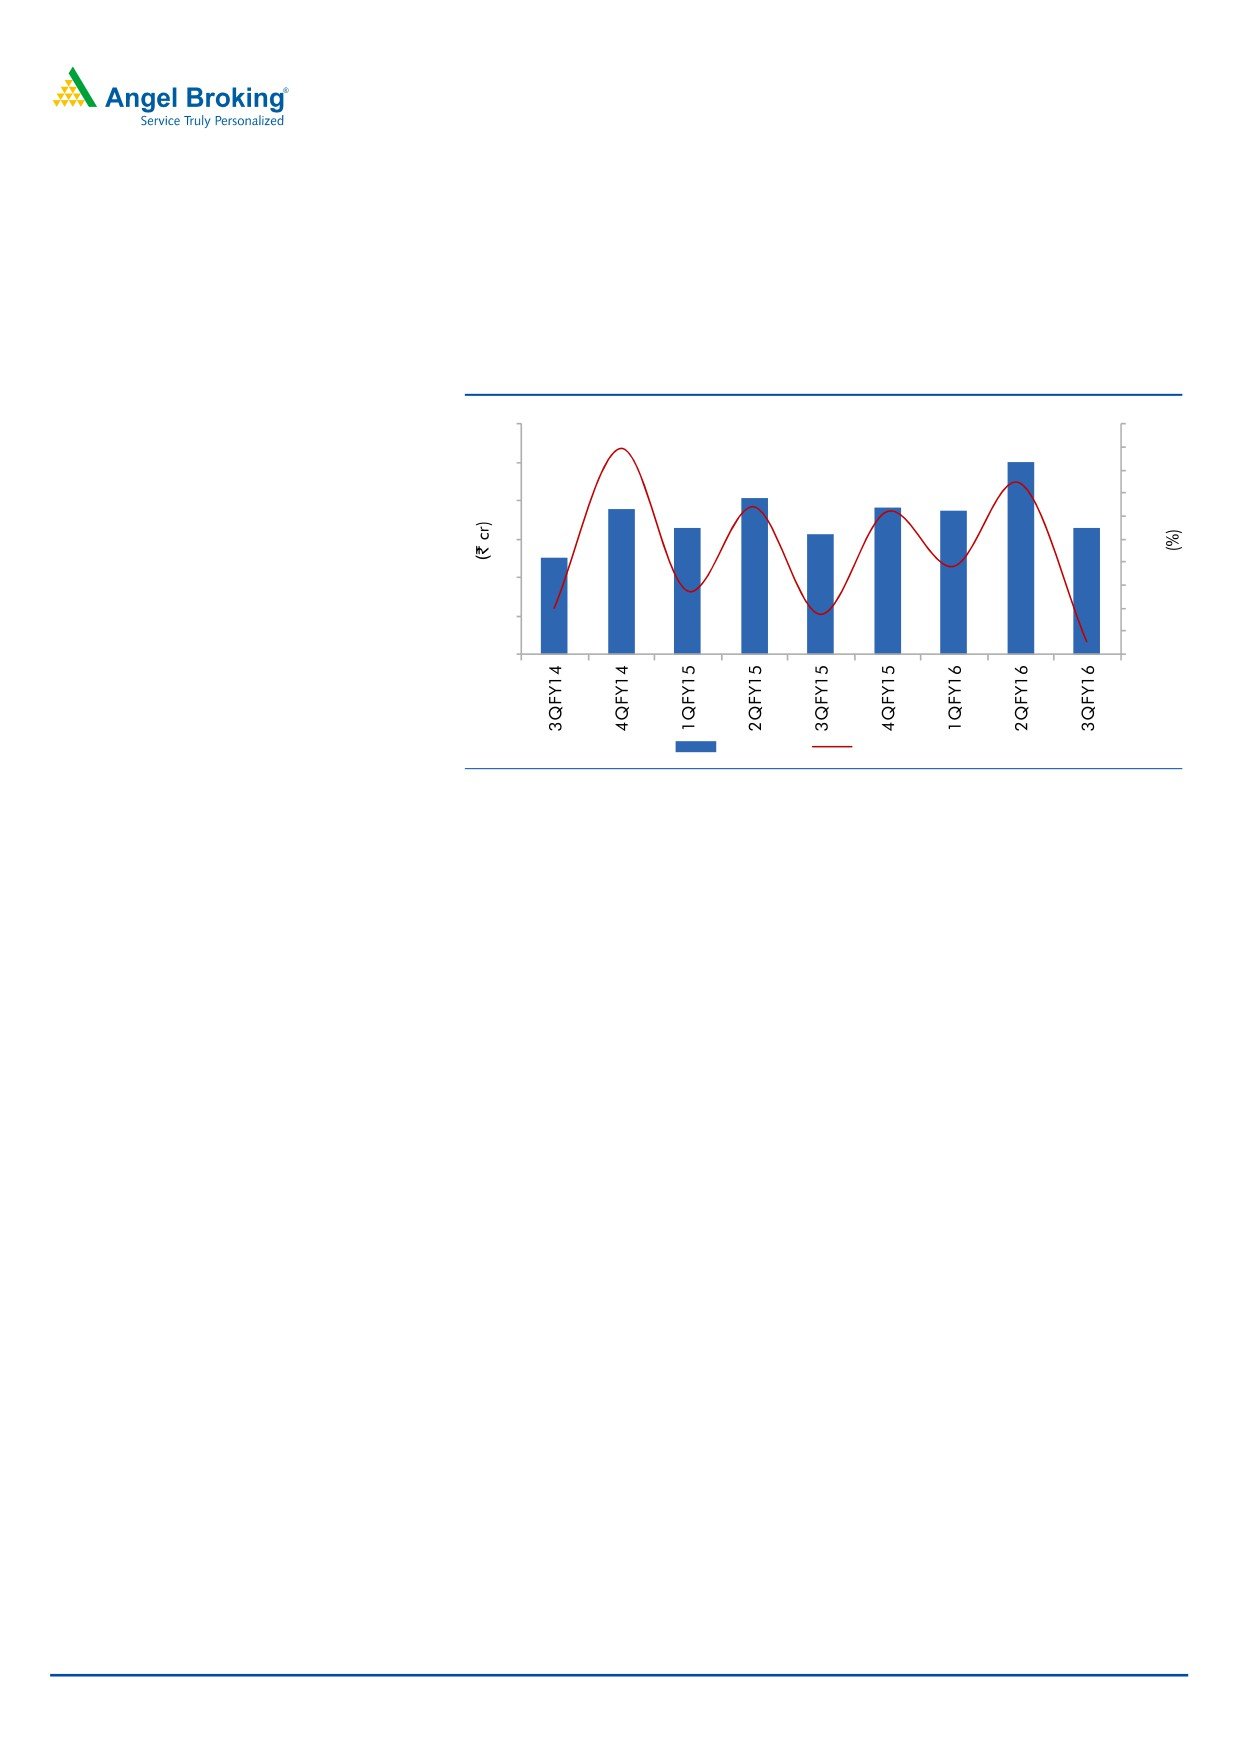
PAT grew ~4% yoy
Despite margin expansion, the reported net profit grew by a soft ~4% yoy to
~`3.3cr (which is below our estimates of ~`3.6cr) on account of lower sales
growth and higher tax rate.
Exhibit 4: Net Profit and growth trend
60
6
50
5
40
30
4
20
3
10
0
2
-10
-20
1
-30
0
-40
Net Profit
QoQ growth (%)
Source: Company, Angel Research
February 08, 2016
4
Linc Pen & Plastics | 3QFY2016 Result Update
Investment rationale
Lower raw material price and product mix change to expand
margins
Going forward, we believe that the company would be able to increase its margins
owing to easing raw material prices including that of high density polyethylene,
polyethylene, nylon etc. which are linked to crude prices. Also, the company is now
targeting higher margin segments like >`10 pens.
Continuous debt repayment & improving return ratios
The company is continuously generating better cash flows, which has resulted in
debt reduction and improvement in ROE. The company has been consistently
repaying debt over the past four years, resulting in debt having come down from
~`43cr in FY2012 to `18cr in FY2015. Going forward, we believe the company
will continue repaying debt with strong cash flows, which in turn will lead to
reduction in interest cost. The interest cost has reduced from ~`3.8cr in FY2012 to
~`1.5cr in FY2015. A lower interest expense in turn will lead to higher profitability
for the company. Further the company’s ROE has improved from 3.6% in FY2012
to 16.2% in FY2015.
Increased focus on western & southern regions coupled with
recovery in export business to accelerate top-line growth
We expect LPPL to report a healthy recovery and post a top-line CAGR of ~8%
over FY2015-17E, on the back of various triggers. These include (a) the company’s
increased focus on southern and western regions (which contributed by less than
25% to the total revenue in FY2015) should contribute additionally to the overall
top-line, (b) the company has a market share of 10% with a strong brand recall.
Further, the company is incurring significant ad spends to boost sales growth, (c)
an expected recovery in exports. The geographies where the company exported
were affected due to political turmoil/socio-economic crises in FY2015; the crisis
has now been resolved (d) the company’s strong distribution network coupled with
continuous new product launches, should aid the top-line
February 08, 2016
5
Linc Pen & Plastics | 3QFY2016 Result Update
Outlook and valuation
Going ahead, we expect LPPL to report a top-line CAGR of ~8% over FY2015-17E
to ~`371cr owing to strong domestic as well as export sales. On the bottom-line
front, we expect the company to report ~17% CAGR over FY2015-17E. This would
be on account of expansion in operating margin on the back of lower material
prices and higher exports, which is a high margin business. Further, the company
has reduced its debt significantly, which will lead to cost saving for the company.
We have a NEUTRAL rating on the stock since all the positives are factored in the
stock price.
Copany Background
LPPL is an India-based company engaged in writing instruments and stationery
business. Its stationery products include pencils (wooden and disposable), sketch
pens, geometry boxes and erasers. The company’s domestic pens market is
divided into ball point pens and gel pens, and comprises of brands like Signature,
Ivy, Royale, Carbon, Elegant, Sleek, Siren and Soffy. Its international pens include
Gliss, Flotech, Gripex, Mission, Orion, Safron Ball, Smartex, Success and Topper.
The company uses plastic granules, ball pen tips, ink, packaging material, springs
and stamping foil as its raw materials. Its manufacturing facilities are located in
Falta (SEZ) and Serakole, both located on the outskirts of Kolkata, and its products
are sold in over 45 countries.
February 08, 2016
6
Linc Pen & Plastics | 3QFY2016 Result Update
Profit & Loss Statement
Y/E March (` cr)
FY12
FY13
FY14
FY15
FY16E
FY17E
Total operating income
275
305
314
318
340
371
% chg
8.4
11.0
2.9
1.3
6.7
9.2
Total Expenditure
265
292
292
293
311
338
Cost of Materials
196
216
216
210
225
245
Personnel Expenses
15
16
17
17
19
21
Others Expenses
54
60
60
65
68
72
EBITDA
10
14
22
25
28
33
% chg
(37.2)
34.4
62.1
14.5
11.6
17.1
(% of Net Sales)
3.7
4.5
7.0
7.9
8.3
8.9
Depreciation& Amortisation
4
4
5
6
6
7
EBIT
6
9
17
19
22
26
% chg
(53.4)
56.8
86.1
14.1
12.7
20.1
(% of Net Sales)
2.1
3.0
5.4
6.1
6.4
7.1
Interest & other Charges
4
2
2
1
2
2
Other Income
0
0
0
0
0
0
(% of PBT)
6.8
5.4
0.6
1.6
1.5
1.2
Share in profit of Associates
-
-
-
-
-
-
Recurring PBT
2
7
15
18
21
25
% chg
(79.7)
220.0
109.2
23.6
12.7
22.1
Prior Period & Extraord. Exps./(Inc.)
-
-
-
-
-
-
PBT (reported)
2
7
15
18
21
25
Tax
1
2
3
4
5
6
(% of PBT)
22.7
23.0
21.9
21.4
22.0
22.0
PAT (reported)
2
5
12
14
16
20
Add: Share of earnings of asso.
-
-
-
-
-
-
Less: Minority interest (MI)
-
-
-
-
-
-
PAT after MI (reported)
2
5
12
14
16
20
ADJ. PAT
2
5
12
14
16
20
% chg
(79.8)
218.8
112.4
24.4
11.8
22.1
(% of Net Sales)
0.6
1.8
3.7
4.5
4.7
5.3
Basic EPS (`)
1.1
3.7
7.8
9.7
10.8
13.2
Fully Diluted EPS (`)
1.1
3.7
7.8
9.7
10.8
13.2
% chg
(79.8)
218.8
112.4
24.4
11.8
22.1
February 08, 2016
7
Linc Pen & Plastics | 3QFY2016 Result Update
Balance Sheet
Y/E March (` cr)
FY12
FY13
FY14
FY15
FY16E
FY17E
SOURCES OF FUNDS
Equity Share Capital
13
15
15
15
15
15
Reserves& Surplus
35
56
64
73
85
100
Shareholders Funds
48
71
79
88
100
114
Minority Interest
-
-
-
-
-
-
Total Loans
43
32
34
18
15
15
Deferred Tax Liability
2
2
2
2
2
2
Total Liabilities
92
104
115
108
117
132
APPLICATION OF FUNDS
Gross Block
55
61
68
72
77
82
Less: Acc. Depreciation
28
32
35
41
48
54
Net Block
28
29
33
30
29
27
Capital Work-in-Progress
1
0
1
0
0
0
Investments
-
-
-
-
-
-
Current Assets
104
118
123
117
131
150
Inventories
63
66
70
64
67
73
Sundry Debtors
33
44
41
40
43
46
Cash
0
0
0
2
4
6
Loans & Advances
5
5
6
5
7
12
Other Assets
3
3
5
7
10
13
Current liabilities
40
44
42
40
43
46
Net Current Assets
64
75
81
77
87
104
Deferred Tax Asset
0
0
0
0
0
0
Total Assets
92
104
115
108
117
132
February 08, 2016
8
Linc Pen & Plastics | 3QFY2016 Result Update
Cashflow Statement
Y/E March (` cr)
FY12
FY13
FY14
FY15
FY16E
FY17E
Profit before tax
2
7
15
18
21
25
Depreciation
4
4
5
6
6
7
Change in Working Capital
3
(12)
(8)
5
(8)
(14)
Interest / Dividend (Net)
4
2
2
1
2
2
Direct taxes paid
(2)
(1)
(3)
(5)
(5)
(6)
Others
(0)
(0)
1
(0)
-
-
Cash Flow from Operations
11
1
11
25
16
14
(Inc.)/ Dec. in Fixed Assets
(36)
(40)
(1)
(4)
(5)
(5)
(Inc.)/ Dec. in Investments
(30)
(35)
8
-
-
-
Cash Flow from Investing
(6)
(5)
(9)
(4)
(5)
(5)
Issue of Equity
-
20
-
-
-
-
Inc./(Dec.) in loans
1
(11)
2
(15)
(3)
-
Dividend Paid (Incl. Tax)
(2)
(1)
(2)
(3)
(4)
(5)
Interest / Dividend (Net)
(4)
(3)
(3)
(1)
(2)
(2)
Cash Flow from Financing
(5)
5
(2)
(20)
(9)
(7)
Inc./(Dec.) in Cash
0
0
(0)
1
2
3
Opening Cash balances
0
0
0
0
2
4
Closing Cash balances
0
0
0
2
4
6
February 08, 2016
9
Linc Pen & Plastics | 3QFY2016 Result Update
Key Ratios
Y/E March
FY12
FY13
FY14
FY15
FY16E FY17E
Valuation Ratio (x)
P/E (on FDEPS)
174.9
54.8
25.8
20.8
18.6
15.2
P/CEPS
49.5
30.1
18.0
14.7
13.3
11.3
P/BV
6.2
4.2
3.8
3.4
3.0
2.6
Dividend yield (%)
0.5
0.7
1.0
1.2
1.4
1.7
EV/Sales
1.2
1.1
1.1
1.0
0.9
0.8
EV/EBITDA
33.5
24.1
15.0
12.4
10.9
9.3
EV / Total Assets
2.6
2.2
2.1
2.1
1.9
1.7
Per Share Data (`)
EPS (Basic & fully diluted)
1.1
3.7
7.8
9.7
10.8
13.2
EPS (Adjusted)
1.1
3.7
7.8
9.7
10.8
13.2
Cash EPS
4.1
6.7
11.2
13.6
15.1
17.8
DPS
1.0
1.5
2.0
2.5
2.8
3.4
Book Value
32.2
47.7
53.2
59.6
67.6
77.4
Returns (%)
ROCE
6.4
9.0
15.2
18.3
19.0
20.3
Angel ROIC (Pre-tax)
6.5
9.0
15.2
18.6
19.7
21.3
ROE
3.6
7.7
14.6
16.2
16.0
17.1
Turnover ratios (x)
Asset Turnover (Gross Block)
5.0
5.0
4.6
4.4
4.4
4.5
Inventory / Sales (days)
84
79
82
73
72
72
Receivables (days)
44
53
48
46
46
45
Payables (days)
35
33
28
25
25
24
WC cycle (ex-cash) (days)
93
99
101
94
93
93
February 08, 2016
10
Linc Pen & Plastics | 3QFY2016 Result Update
Research Team Tel: 022 - 39357800
DISCLAIMER
Angel Broking Private Limited (hereinafter referred to as “Angel”) is a registered Member of National Stock Exchange of India Limited,
Bombay Stock Exchange Limited and Metropolitan Stock Exchange of India Limited. It is also registered as a Depository Participant with
CDSL and Portfolio Manager with SEBI. It also has registration with AMFI as a Mutual Fund Distributor. Angel Broking Private Limited is
a registered entity with SEBI for Research Analyst in terms of SEBI (Research Analyst) Regulations, 2014 vide registration number
INH000000164. Angel or its associates has not been debarred/ suspended by SEBI or any other regulatory authority for accessing
/dealing in securities Market. Angel or its associates including its relatives/analyst do not hold any financial interest/beneficial
ownership of more than 1% in the company covered by Analyst. Angel or its associates/analyst has not received any compensation /
managed or co-managed public offering of securities of the company covered by Analyst during the past twelve months. Angel/analyst
has not served as an officer, director or employee of company covered by Analyst and has not been engaged in market making activity
of the company covered by Analyst.
This document is solely for the personal information of the recipient, and must not be singularly used as the basis of any investment
decision. Nothing in this document should be construed as investment or financial advice. Each recipient of this document should
make such investigations as they deem necessary to arrive at an independent evaluation of an investment in the securities of the
companies referred to in this document (including the merits and risks involved), and should consult their own advisors to determine
the merits and risks of such an investment.
Reports based on technical and derivative analysis center on studying charts of a stock's price movement, outstanding positions and
trading volume, as opposed to focusing on a company's fundamentals and, as such, may not match with a report on a company's
fundamentals.
The information in this document has been printed on the basis of publicly available information, internal data and other reliable
sources believed to be true, but we do not represent that it is accurate or complete and it should not be relied on as such, as this
document is for general guidance only. Angel Broking Pvt. Limited or any of its affiliates/ group companies shall not be in any way
responsible for any loss or damage that may arise to any person from any inadvertent error in the information contained in this report.
Angel Broking Pvt. Limited has not independently verified all the information contained within this document. Accordingly, we cannot
testify, nor make any representation or warranty, express or implied, to the accuracy, contents or data contained within this document.
While Angel Broking Pvt. Limited endeavors to update on a reasonable basis the information discussed in this material, there may be
regulatory, compliance, or other reasons that prevent us from doing so.
This document is being supplied to you solely for your information, and its contents, information or data may not be reproduced,
redistributed or passed on, directly or indirectly.
Neither Angel Broking Pvt. Limited, nor its directors, employees or affiliates shall be liable for any loss or damage that may arise from
or in connection with the use of this information.
Note: Please refer to the important ‘Stock Holding Disclosure' report on the Angel website (Research Section). Also, please refer to the
latest update on respective stocks for the disclosure status in respect of those stocks. Angel Broking Pvt. Limited and its affiliates may
have investment positions in the stocks recommended in this report.
Disclosure of Interest Statement
Linc Pen & Plastics
1. Analyst ownership of the stock
No
2. Angel and its Group companies ownership of the stock
No
3. Angel and its Group companies' Directors ownership of the stock
No
4. Broking relationship with company covered
No
Note: We have not considered any Exposure below ` 1 lakh for Angel, its Group companies and Directors
Ratings (Based on expected returns
Buy (> 15%)
Accumulate (5% to 15%)
Neutral (-5 to 5%)
over 12 months investment period):
Reduce (-5% to -15%)
Sell (< -15%)
February 08, 2016
11